2 charts from former Labor Secretary Robert Reich show what went wrong.
Income inequality rose sharply before the Great Depression. Thankfully, Franklin Roosevelt ushered in tax and regulatory fairness. In the post-Roosevelt years, things got much better. Enter Ronald Reagan in 1980. He slashed taxes, killed consumer protections and the wage gap has widened ever since. This chart shows the dramatic trajectory of income inequality since 1920:
WAGE GAP SINCE 1920
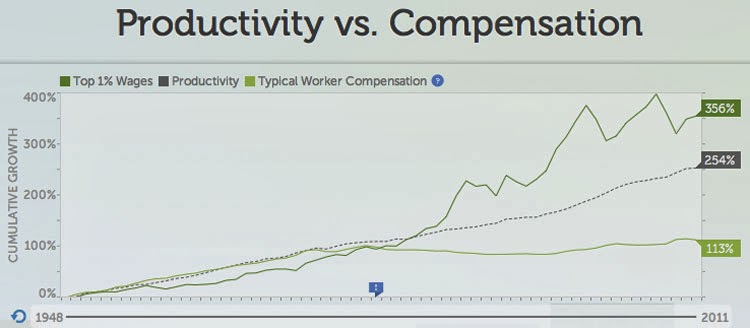
From the end of WWII until 1980, as productivity increased, so did wages (of both the top 1% and the average worker)--at about the same rate. Then, beginning in 1980, productivity kept going up. So did the income of the top 1%. But the typical worker's income stopped rising. Pretty much all of the wealth created went to the top 1%. This chart clearly illustrates the grotesque inequity caused by massive tax cuts and deregulation.